

Property Market Overview

Forest Lake and Ellen Grove Property Market Overview

Forest Lake & Ellen Grove Property Market Overview

Sales analysis to 3 September 2026

Published 6 September 2026

At a Glance

Forest Lake and Ellen Grove headline property market comparison
SuburbHouse MedianUnit MedianResidential SalesHouse Median Days to Sell
Forest Lake$1,100,777 (3-Mo)$685,000 (3-Mo)70 (3-Mo)21 days (3-Mo)
Ellen Grove$913,000 (12-Mo)$690,000 (12-Mo)63 (12-Mo)25 days (12-Mo)
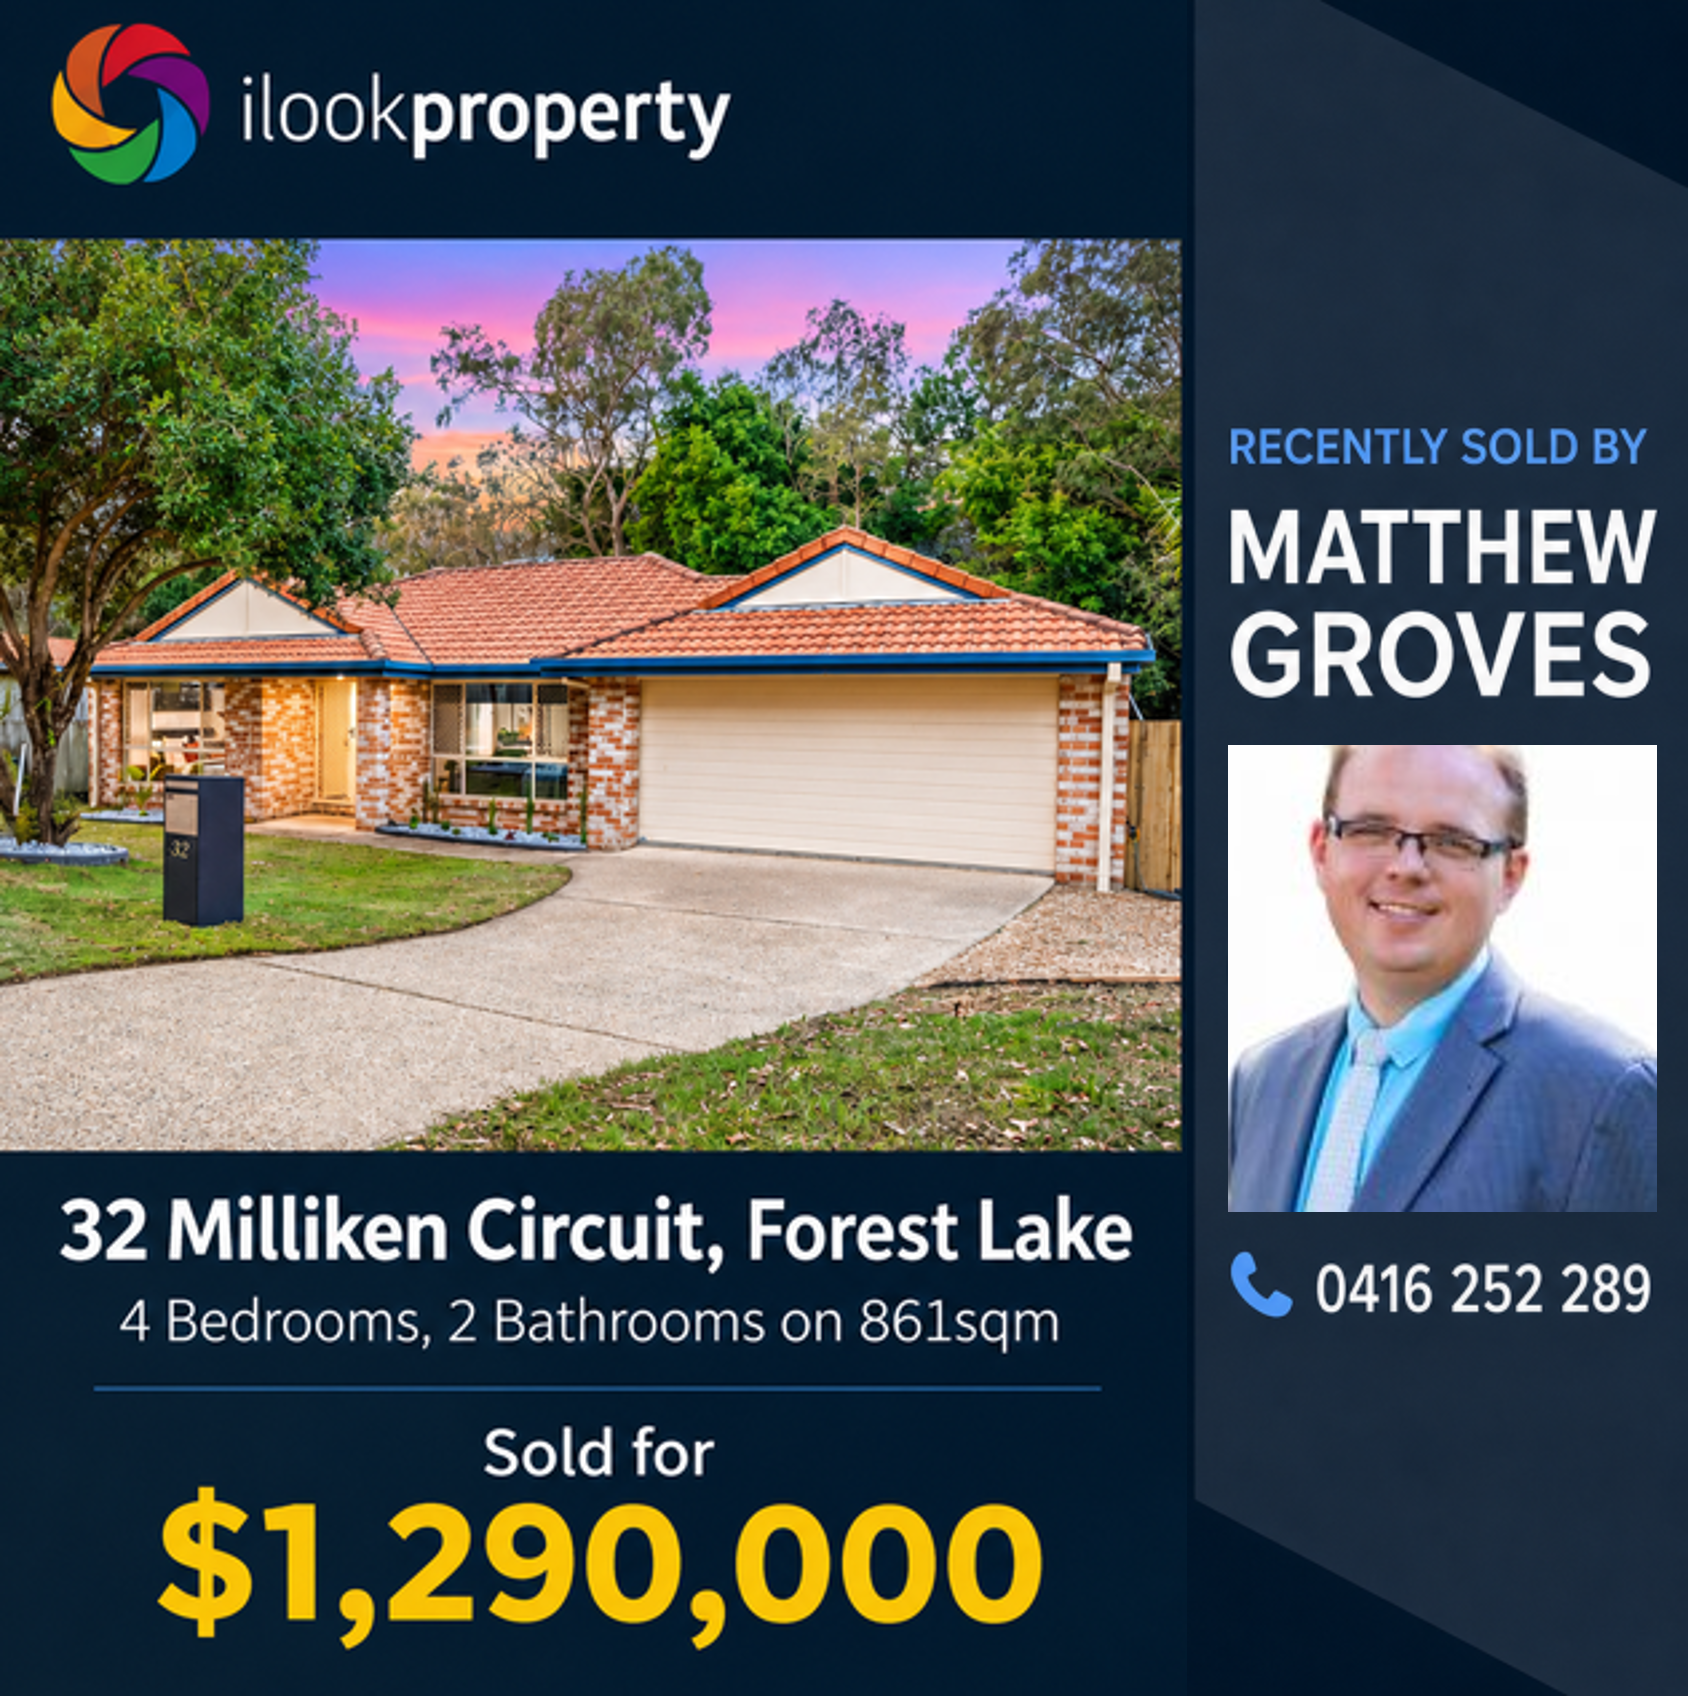
Forest Lake

Forest Lake Market Snapshot

3-Month House Median
$1,100,777
+9.5% vs 12-month median of $1,005,000
3-Month Unit Median
$685,000
+1.5% vs 12-month median of $675,000 · 1 priced sale
3-Month Residential Volume
70
69 houses + 1 unit in the available 3-month transaction counts
Median Days to Sell
21 days
Houses · trailing 3 months

Monthly Median Price — Trailing 12 Months

Houses

Units
Bedroom Breakdown — Trailing 3 Months

Forest Lake house sales by known bedroom count, trailing three months
Forest Lake unit sales by known bedroom count, trailing three months

Top Sales — Trailing 3 Months

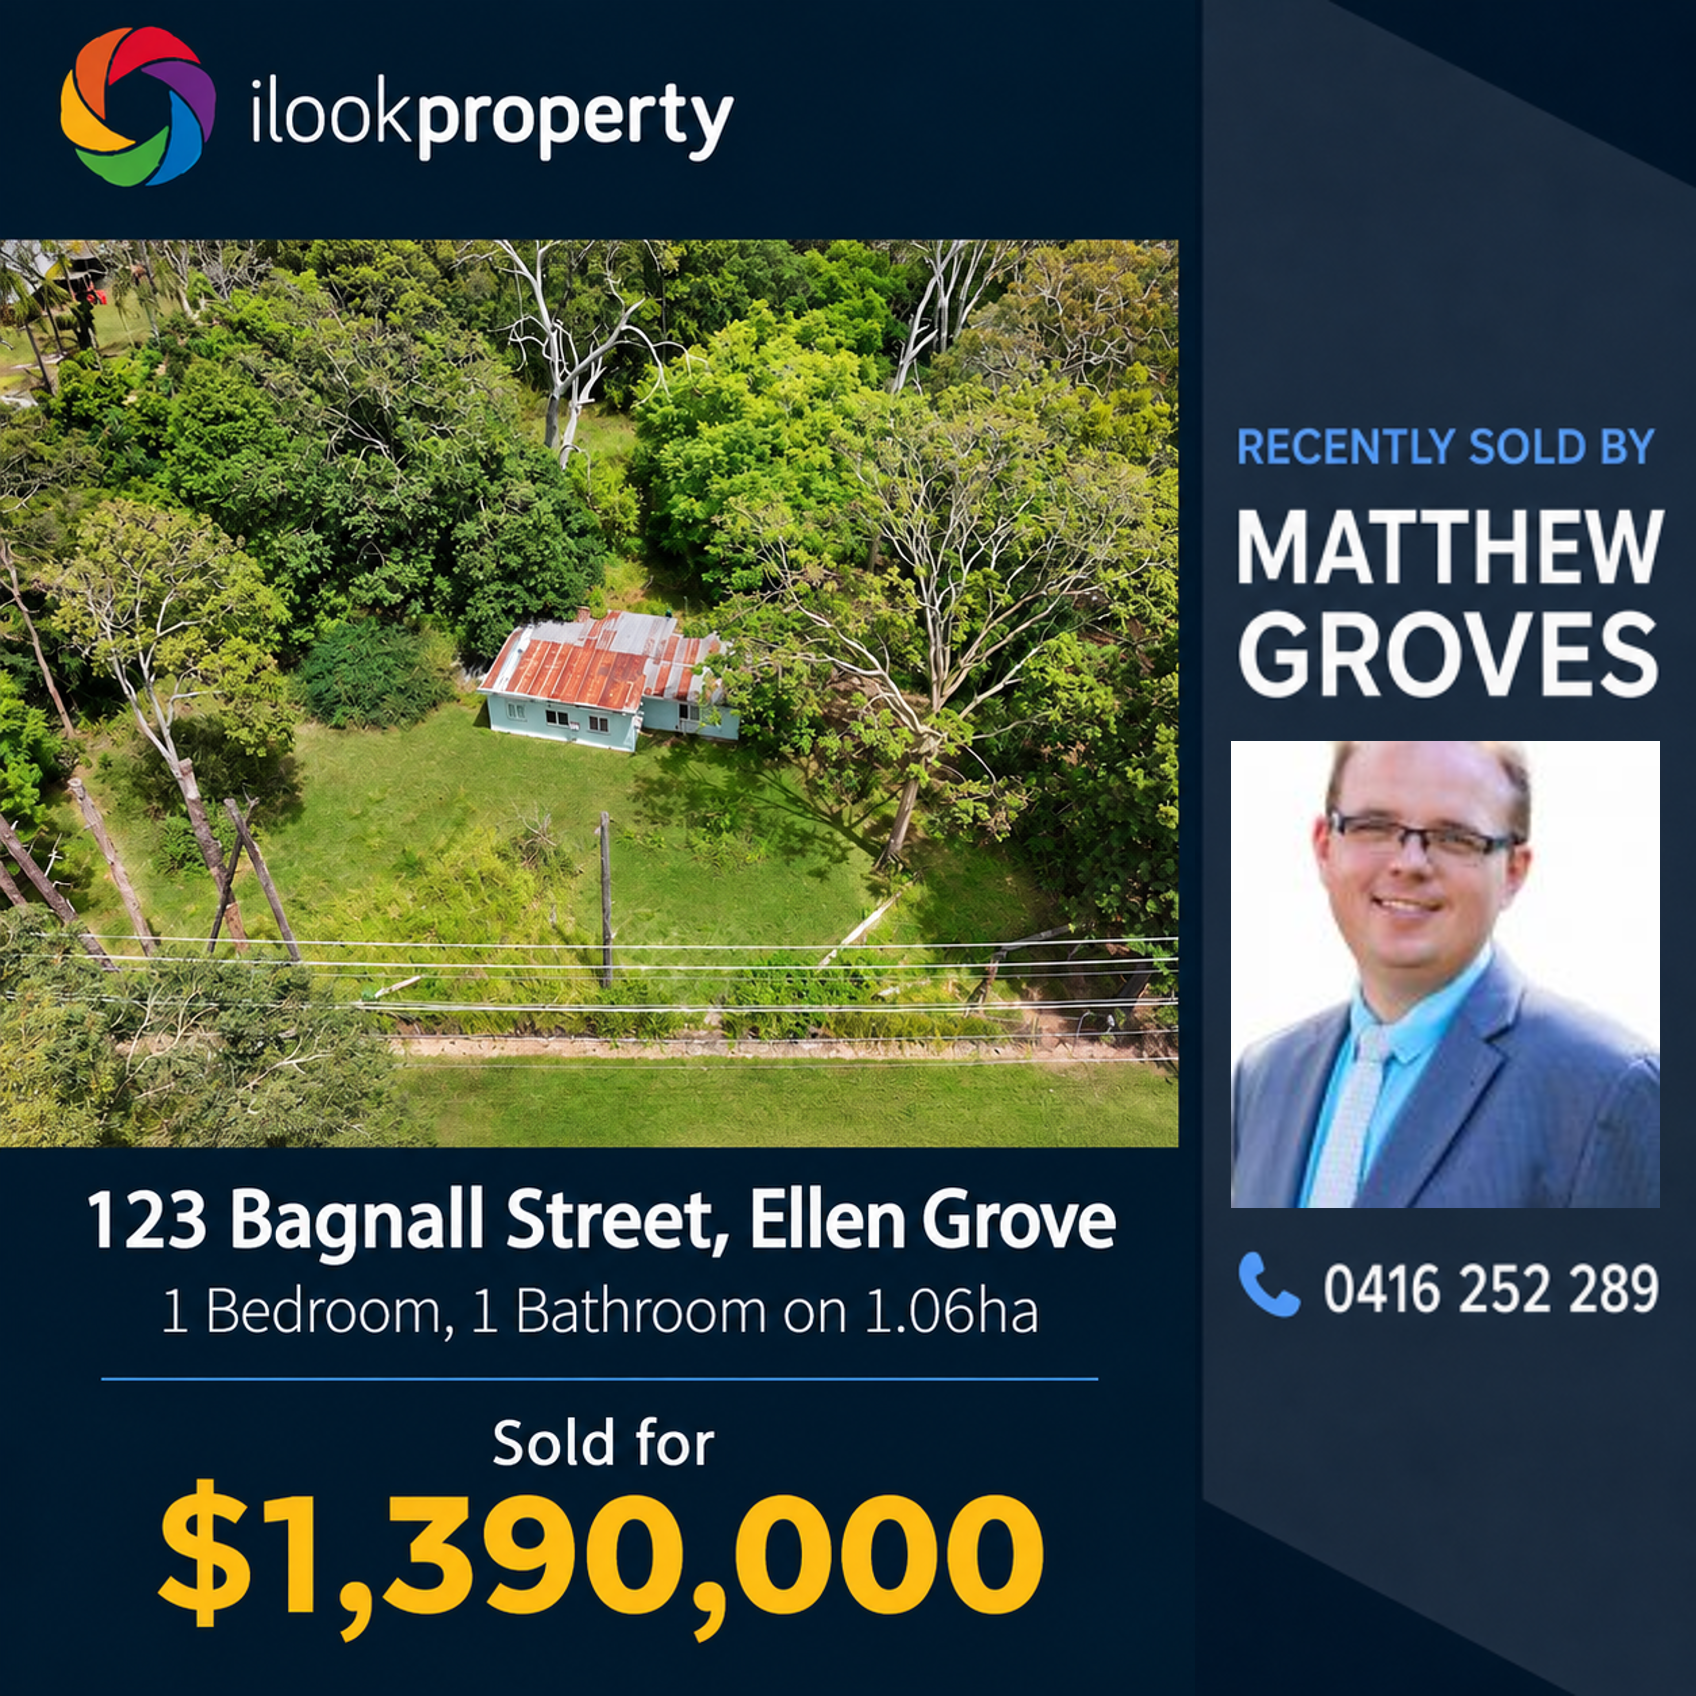
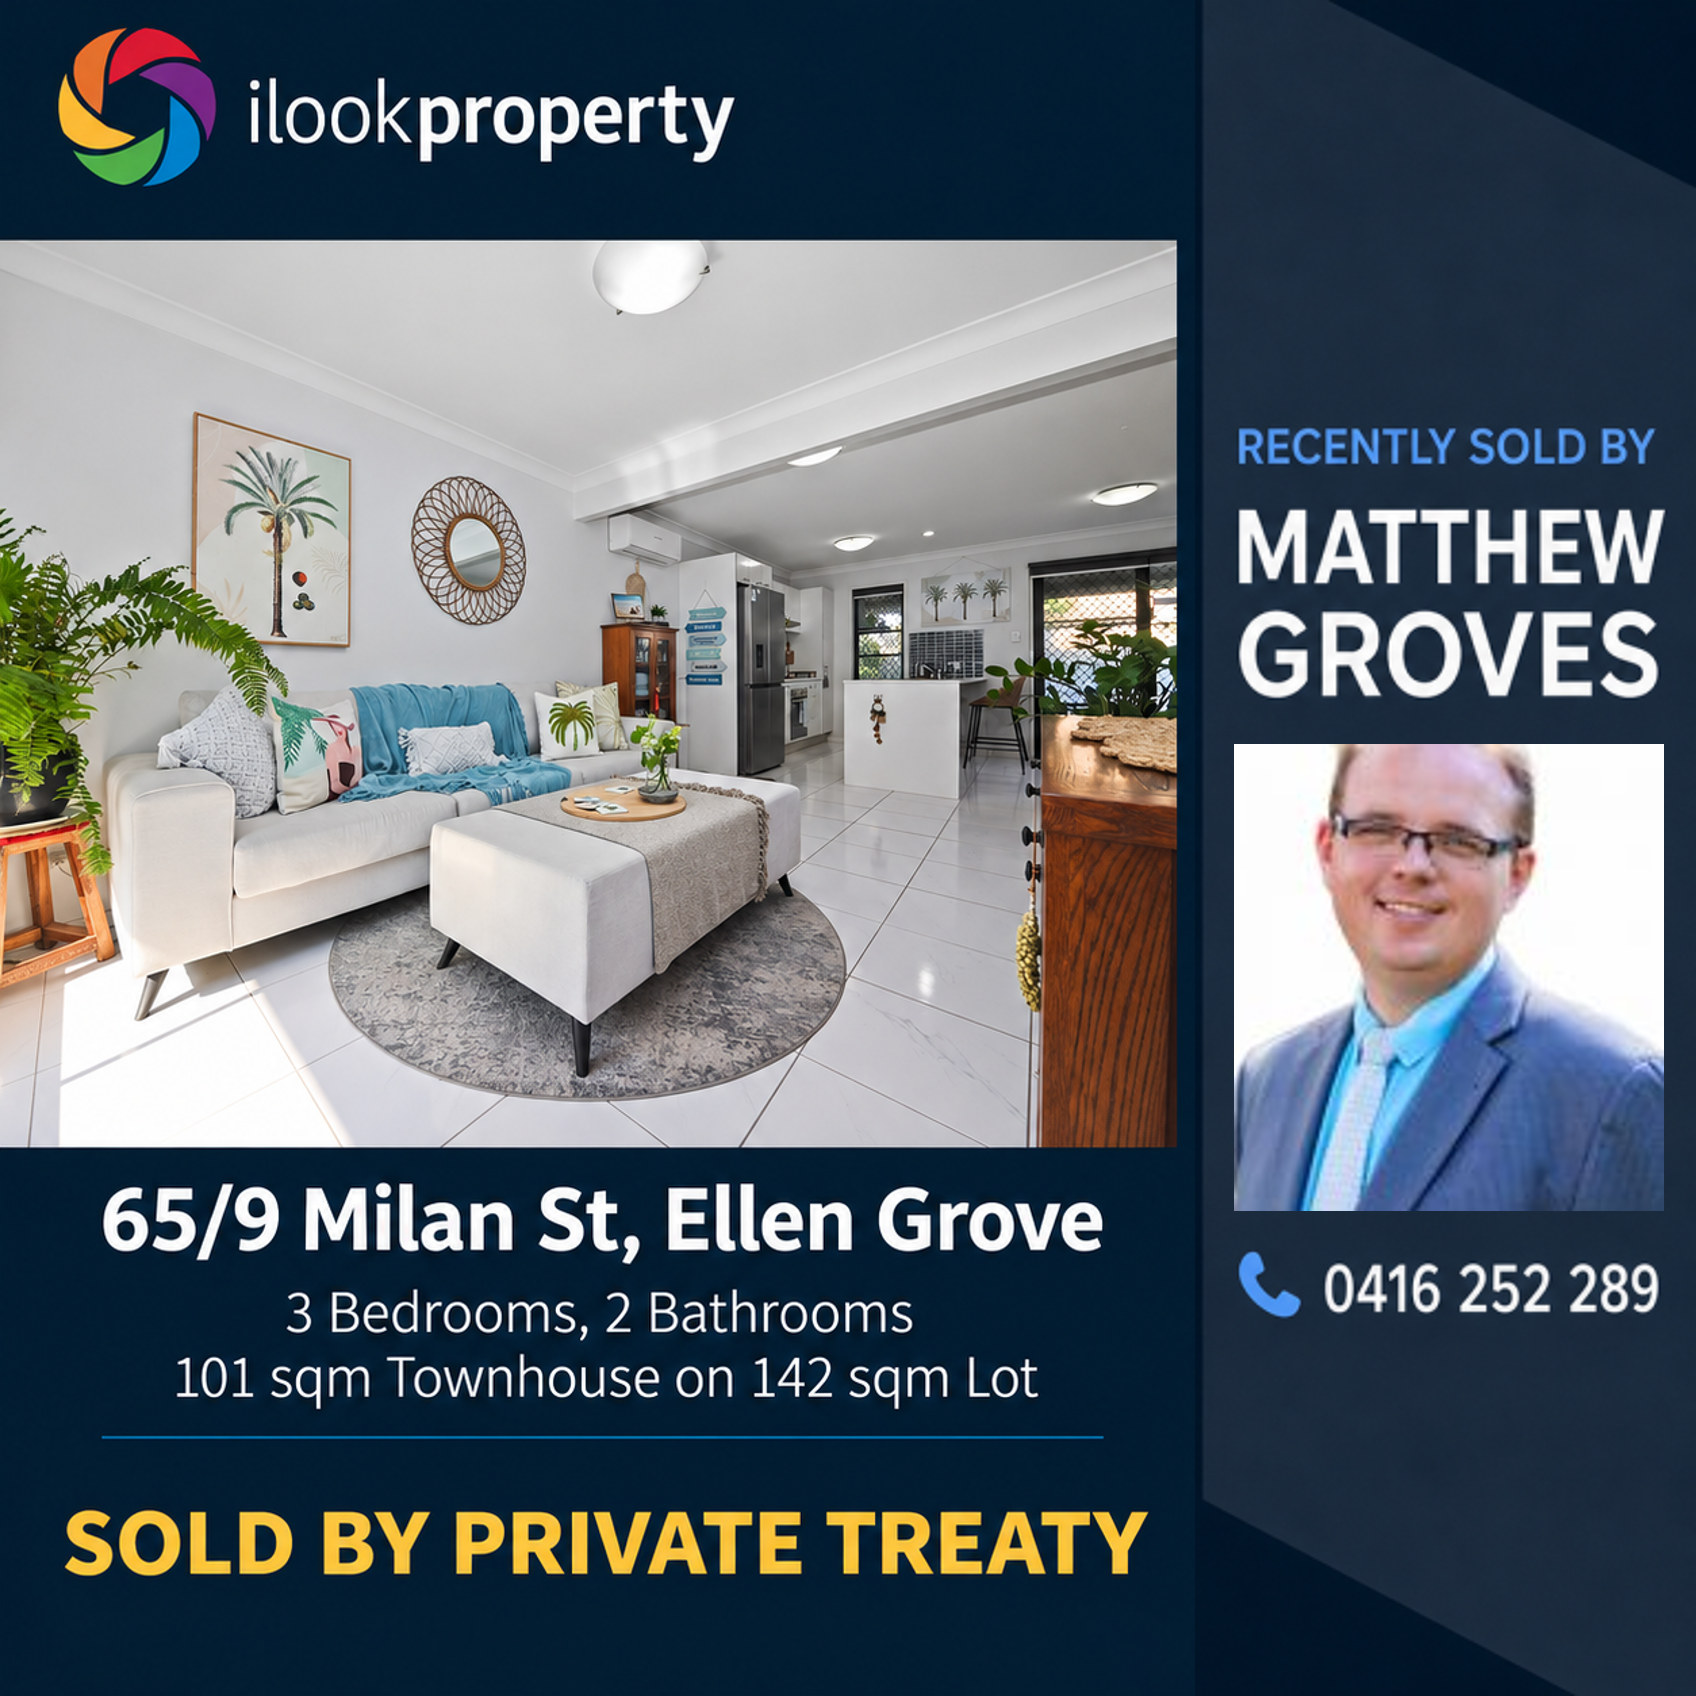
Ellen Grove

Ellen Grove Market Snapshot

The supplied Ellen Grove dataset supports a 12-month view rather than a defensible trailing 3-month snapshot. The figures below therefore remain on the supplied 12-month basis.
12-Month House Median
$913,000
19 priced house sales · 25 days median DOM
12-Month Unit Median
$690,000
44 priced unit sales · 9 days median DOM
12-Month Residential Volume
63
19 houses + 44 units in the available 12-month transaction counts
House Median Days to Sell
25 days
Trailing 12 months

Monthly Median Price — Trailing 12 Months

Houses

Units
Bedroom Breakdown — Trailing 12 Months
Ellen Grove house sales by known bedroom count, trailing twelve months
Ellen Grove unit sales by known bedroom count, trailing twelve months

Top Sales — Trailing 12 Months

Data Notes

  1. Median-price calculations use transactions with a usable recorded sale price. The supplied summary fields do not separately expose a fuller total-transaction count and a priced-median count, so the displayed volume uses the available transaction counts and is not represented as a separately verified broader volume.
  2. Monthly medians can fluctuate substantially where sales volumes are low. Individual monthly figures should be read alongside the transaction volume shown on each chart. Only months with a qualifying monthly median in the analysed dataset are plotted.
  3. Bedroom breakdowns include only transactions with usable bedroom information in the analysed dataset. Bedroom-category totals may therefore be lower than the transaction counts shown elsewhere.
  4. Forest Lake recorded only one unit sale in the supplied trailing three-month summary, so its three-month unit median and days-to-sell figure are not a robust indicator of the wider unit market.
  5. The supplied Ellen Grove summary is explicitly 12-month-only. No three-month Ellen Grove medians, volumes or days-to-sell figures have been inferred or manufactured.
  6. Agent Activity is omitted because agent-attribution data is not present in the supplied report dataset.

Disclaimer

Published 6 September 2026. This overview is based on property transaction data available for the periods stated above and is a general market summary for informational purposes only. It is not financial, investment, legal or real estate advice. Figures, medians and rankings are indicative, property markets can change, and readers should conduct their own research and seek appropriate professional advice before making property decisions. Where a source dataset distinguishes total transactions from transactions with usable prices, sales volume may include transactions excluded from median calculations; the supplied summary for this report does not expose those counts separately.

Join Mailing List

Local Resources


Matthew Groves

Macca


Macca After Content Tower Ad
Matthew Groves

Macca Mobile Tower Ad


Spread the love